
Seeing the community from another perspective

During the Tuesday, April 19, Policies and Priorities Committee Meeting, Whitecourt Town Council received a walkthrough of the GIS MuniSight system available on the town’s website. Director of Planning and Development Jennine Loberg gave Council an in-depth explanation of what the program is for and what it can do, both for town staff and community members.
GIS stands for Geographical Information System. The system enables residents to see a variety of facilities and infrastructure in the community, such as lot lines, sizing and zoning and features a zoomable aerial viewpoint. The Town of Whitecourt began working with MuniSight in early 2020 and officially launched it later that year. Last year was the first full year with the system up and running for use, and Loberg said it is growing in popularity.
The feature is found easiest by scrolling down to the very bottom of the opening page of the town’s website (www.whitecourt.ca) and clicking on MuniSight- GIS Information under Related Links, then clicking Enter MuniSight on the next page that opens. No registration is needed. Residents can click on “Log in as guest” and give it a moment to load. The last step is to read the disclaimer and click Agree. Once opened, ten layers can be opened on the left-hand side. Layers include Base Features, Property Features, Planning & Development, Land Use Districts, Parks, and Recreation, Municipal, Water Utilities, Wastewater Utilities, Storm Sewer Utilities, and Transportation.
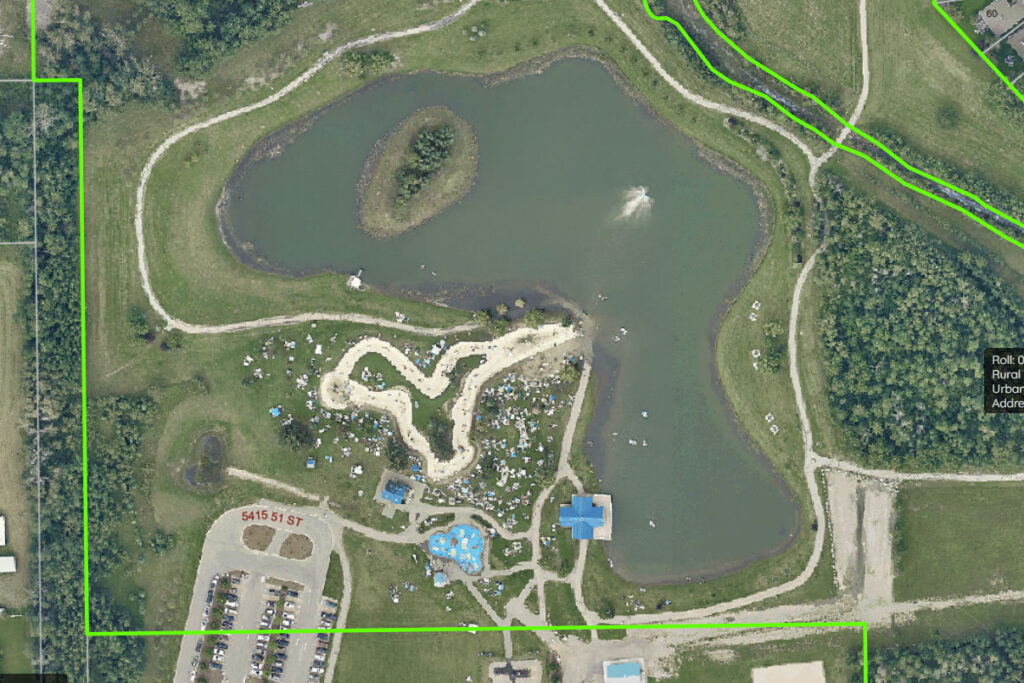
On the far right upper corner, a box says Imagery, which enables residents to see the aerial views. There are three options, 2019, 2014 and Historical. Selecting 2019 Orthos and clicking submit shows the map come to life with colour and allows users to zoom in closely on specific properties and areas. For someone looking to buy a home, this tool gives a bird’s eye view of the property size and area and provides details on assessments or permits on the property with a mouse click. For a developer, this can give a better understanding of the different areas in town they are interested in for a project. To get back out of the aerial view, and use other system features, unclick the selected Orthos box and hit submit.
Next up is the list of layers on the left. “Property Features will show your lot block, plan boundaries, and lot lines. A question we get asked a lot is what is the size of my lot. If you click the dimension line and zoom in (on the specific property), you can see the dimensions. It will show you your width, length, etcetera,” explained Loberg. She said zooming in was important because not everything will show otherwise, including street names. The closer users zoom in, the more information they will see.
Under Right of Ways, users can see shallow utilities. “It’s a good indication for me if you’ve got shallow utilities. We have all of our deep utilities, for the most part, mapped, so this is a good indication if you’ve got power, water or gas or something in the front of your property,” she explained.
Another handy bit of information comes under the Planning and Development toggle. There are three checkboxes available, Flood Fringe, Flood Way, and Fire Smart Map. The provincial flood-related maps show residents which areas fall within that margin, which might be handy for a developer or realtor to know when planning with clients. The FireSmart mapping showcases the multitude of areas completed by FireSmart over the years, to which Councillor Derek Schlosser remarked, “wow.”
The next tab is Land Use Districts which features a long list of options. “You can either click the first button, which is all of your Land Use Districts that’ll show up (or click on each one individually). The nice thing about this is that when this layer is on, you can click any property, and it’ll bring you up to your Land Use Districts page,” said Loberg. The page that pops up then shows users their permitted discretionary uses, the site regulations, and standard setbacks in that district. “It’ll bring you right to the page associated with that Land Use District.”
Details on when buildings and homes were built are among the most asked questions from residents calling the town. Loberg said those details are easy to find on MuniSight. She noted that clicking on a specific property will open a pop-up tab with two tabs near the bottom. “Click on the Assessment tab. It’ll tell you your land area, zoning, and what your use is on that property. It’ll also tell you the area of your building, what year it was built, and your 2021 assessment.”
The location and length of area trails are also listed, as are community parks. Under Municipal, residents can see the garbage collection map and see which areas receive collection on which days. The last few toggles include water and wastewater utilities, storm sewers and transportation, which breaks down the bus schedule and snow removal.
Another feature is that residents can measure out a planned project (using the pencil and ruler tools between the map and legend toggles), such as a shed or deck, and submit it to the town for a permit by printing out a screenshot. “We are seeing more and more people use this. We are actually surprised at how well the public has taken up on this. We thought it would be more of an internal staff tool, but our usage rates show that almost 50 percent of them are public,” said Loberg. Updates and changes continue to happen as feedback is received. “We have lots of wish lists that we want to build onto this,” she said.
You must be logged in to post a comment Login